


Run a Sample Cloudflow Application on GCP
Setting up the Cloudflow kubectl Plugin
With Cloudflow installed on a GKE cluster through the Marketplace, you can interact with Cloudflow via its kubectl plugin: kubectl cloudflow.
If you haven’t already, download and set up the kubectl plugin following the instructions.
Then connect your local kubectl to the GKE cluster on which Cloudflow is installed. You can find the command to do that from the "Clusters" view:
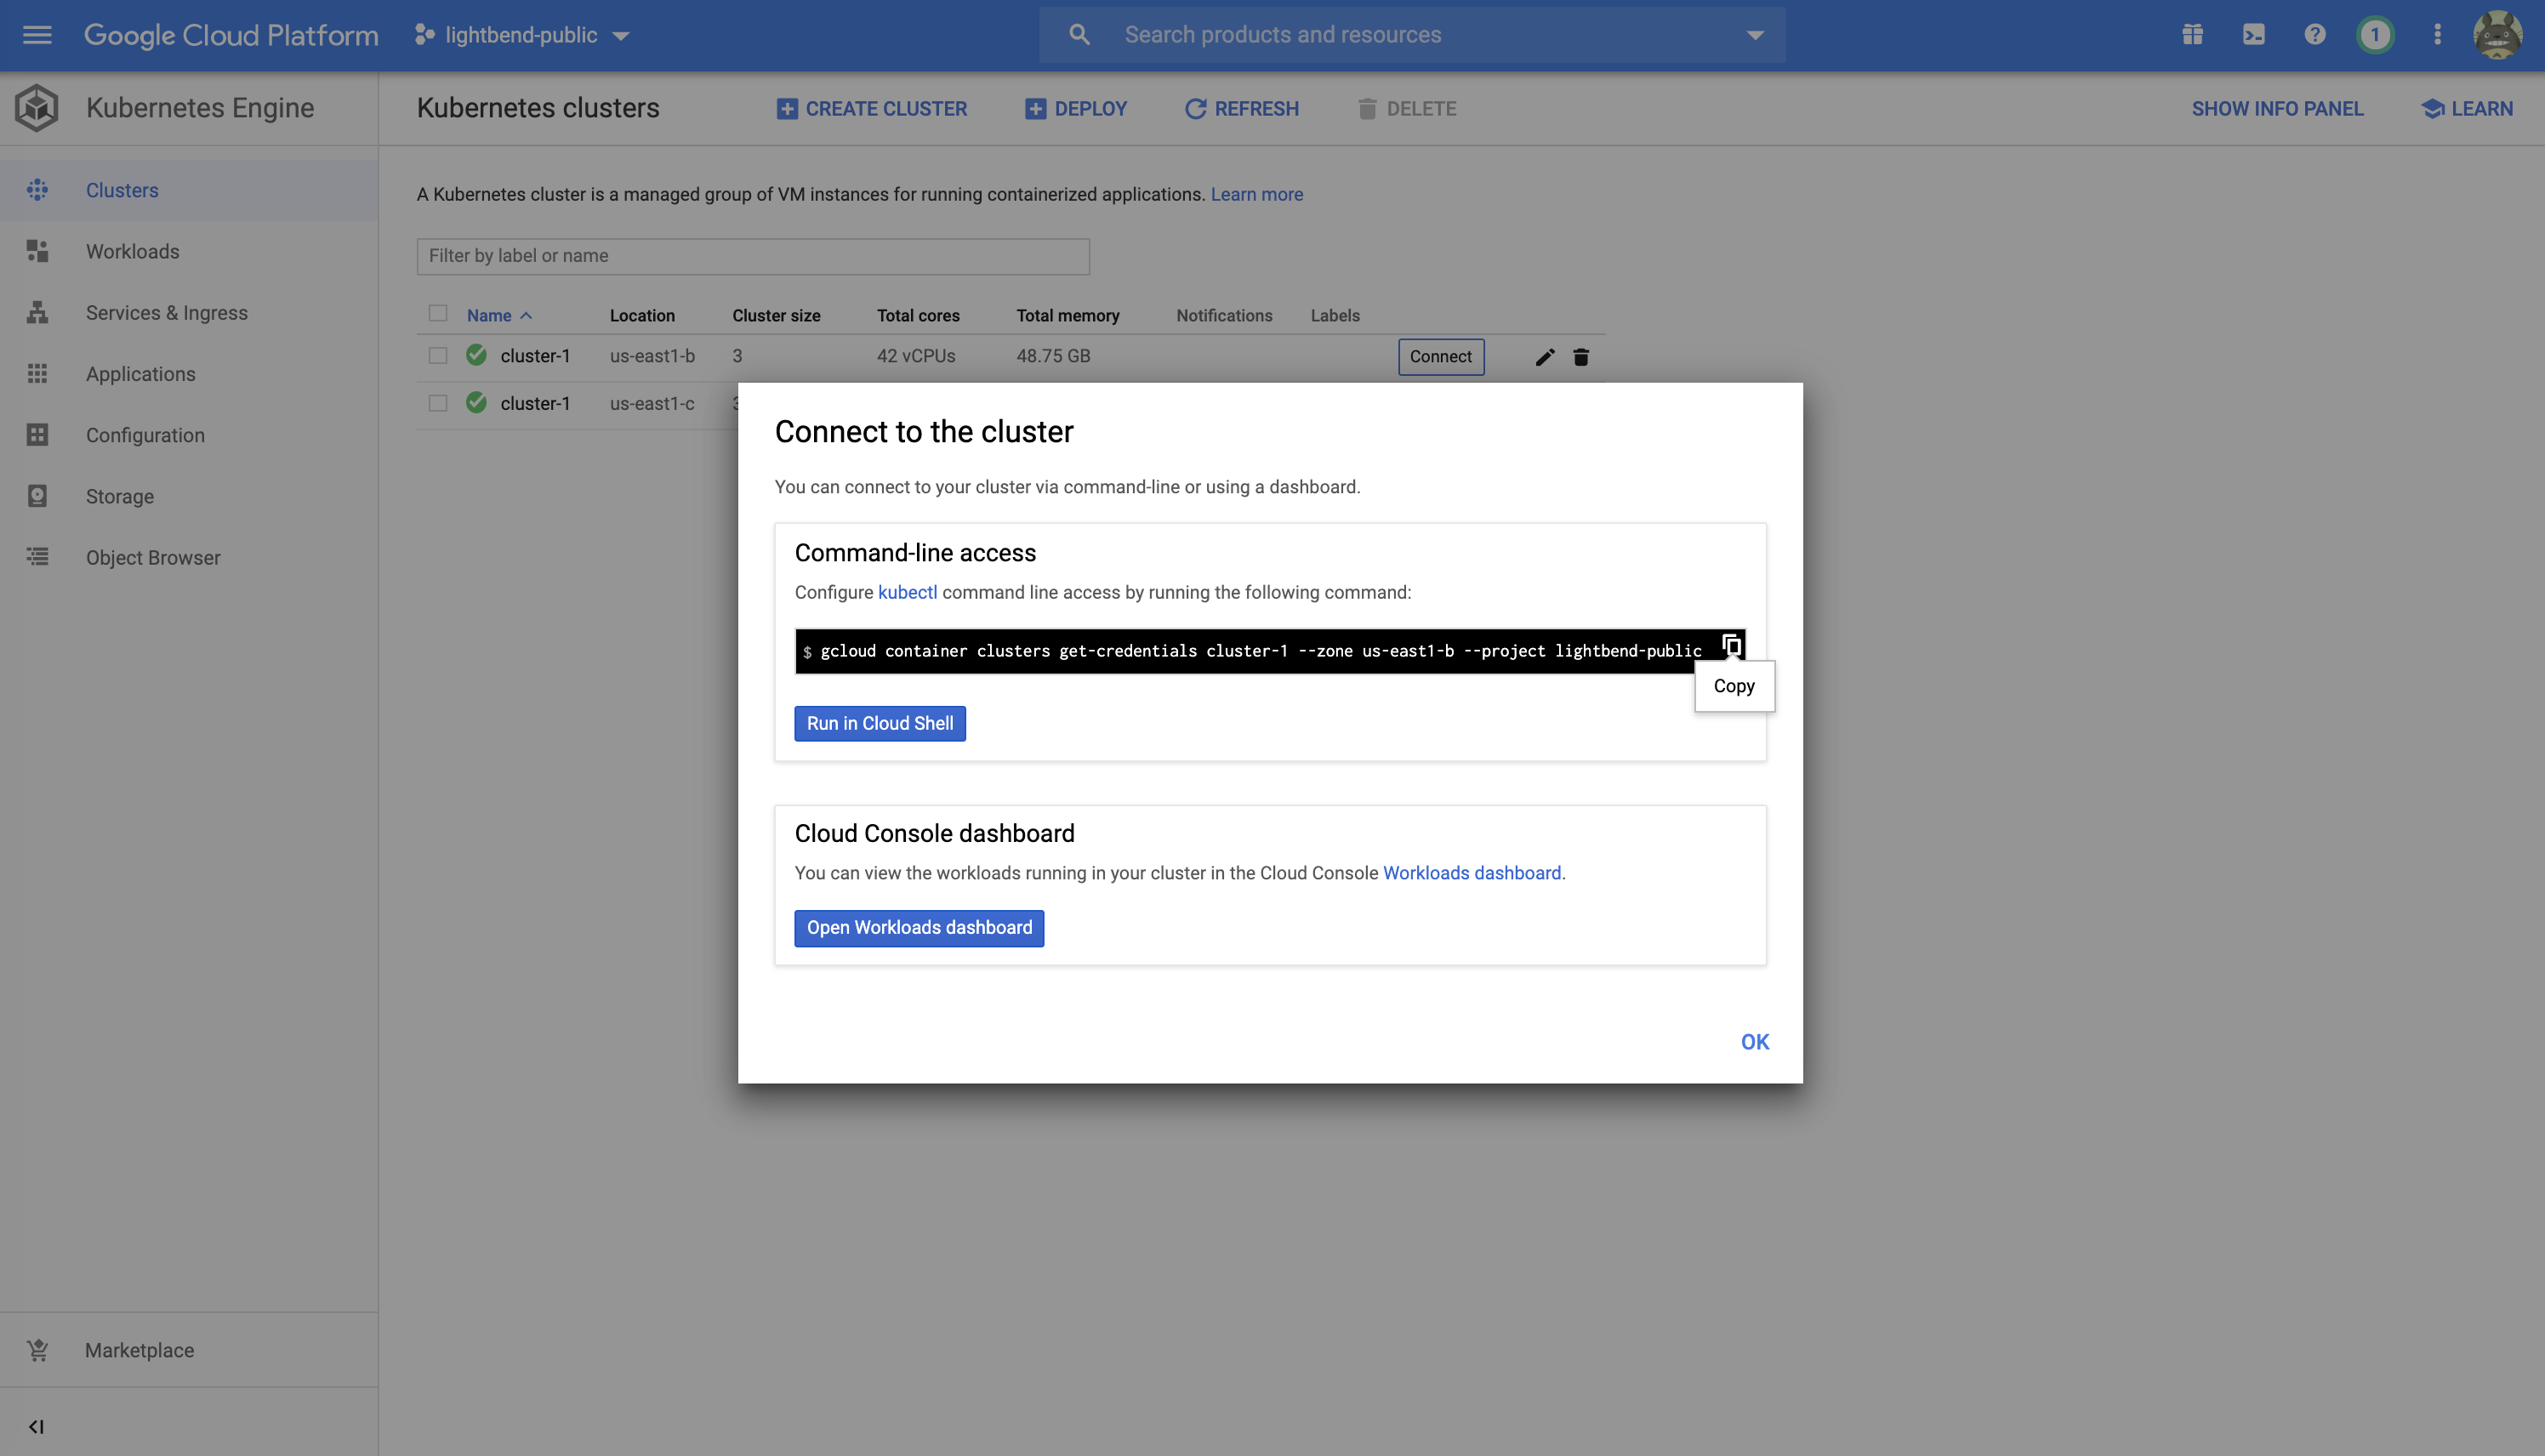
kubectl to GKE clusterIt should look like the following:
$ gcloud container clusters get-credentials <cluster-name> --zone <zone> --project <gcp-project>Where cluster-name refers to your Kubernetes cluster, as identified here, and gcp-project refers to your Google Cloud project.
Building and Deploying call-record-aggregator
Next we’ll deploy a sample Cloudflow application called call-record-aggregator to the cluster.
Clone the Cloudflow Github repo and cd into the examples/call-record-aggregator directory.
Check that you have a file named target-env.sbt containing the Docker registry and repository that application images will be pushed to.
Refer to target-env.sbt.example for a template.
For example, if you are using Google Container Registry (GCR), your target-env.sbt should look like below:
ThisBuild / cloudflowDockerRegistry := Some("<region>.gcr.io")
ThisBuild / cloudflowDockerRepository := Some("<gcloud-project-id>")
Where region is us, eu, asia, or empty, in which case the dot following it should be omitted too.
The next step is to log in to the Docker registry specified in target-env.sbt.
For most registries, docker login will work.
For GCR, you can also run gcloud auth configure-docker.
Now run the following command to build the application:
$ sbt buildAppThis step may take several minutes to complete, as it will build and push multiple Docker images to the Docker repository configured in target-env.sbt.
Once it’s complete, you should see at the end of the output a kubectl cloudflow deploy command to deploy your application. Run it:
$ kubectl cloudflow deploy call-record-aggregator.json| You might be prompted to enter credentials for the Docker registry that hosts your application images, if this is your first time deploying an application using that registry. |
Once the deployment of the application starts, you can view the progress of the application using the kubectl cloudflow status command:
$ kubectl cloudflow status call-record-aggregator
Name:             call-record-aggregator
Namespace:        call-record-aggregator
Version:          473-d654162-dirty
Created:          2020-06-23 10:17:00 -0400 EDT
Status:           Running

STREAMLET         POD                                                        READY             STATUS            RESTARTS
cdr-aggregator    call-record-aggregator-cdr-aggregator-driver               1/1               Running           0
cdr-aggregator    call-record-aggregator-cdr-aggregator-1592921825294-exec-1 1/1               Running           0
cdr-generator1    call-record-aggregator-cdr-generator1-driver               1/1               Running           0
cdr-generator1    call-record-aggregator-cdr-generator1-1592921825612-exec-1 1/1               Running           0
cdr-generator2    call-record-aggregator-cdr-generator2-driver               1/1               Running           0
cdr-generator2    call-record-aggregator-cdr-generator2-1592921825136-exec-1 1/1               Running           0
cdr-ingress       call-record-aggregator-cdr-ingress-665b79f7b5-b8k6g        1/1               Running           0
console-egress    call-record-aggregator-console-egress-dd8667b84-lv7tm      1/1               Running           0
error-egress      call-record-aggregator-error-egress-87574b5c4-w7mqs        1/1               Running           0
split             call-record-aggregator-split-54f5844cf5-z8fp2              1/1               Running           0
Using Lightbend Console
Lightbend Console is a suite of tools provided by Lightbend that enables observing and monitoring Kubernetes applications.
To monitor the call-record-aggregator application you just deployed, run kubectl port-forward on the console-frontend deployment:
$ kubectl -n <cloudflow-namespace> port-forward deployment/console-frontend 8080:8080
Setting up an Ingress is the recommended production-ready mechanism of accessing Lightbend Console. Refer to the Console documentation on how to set it up.
|
Now from the browser, go to http://127.0.0.1:8080/ and you should see the following page:
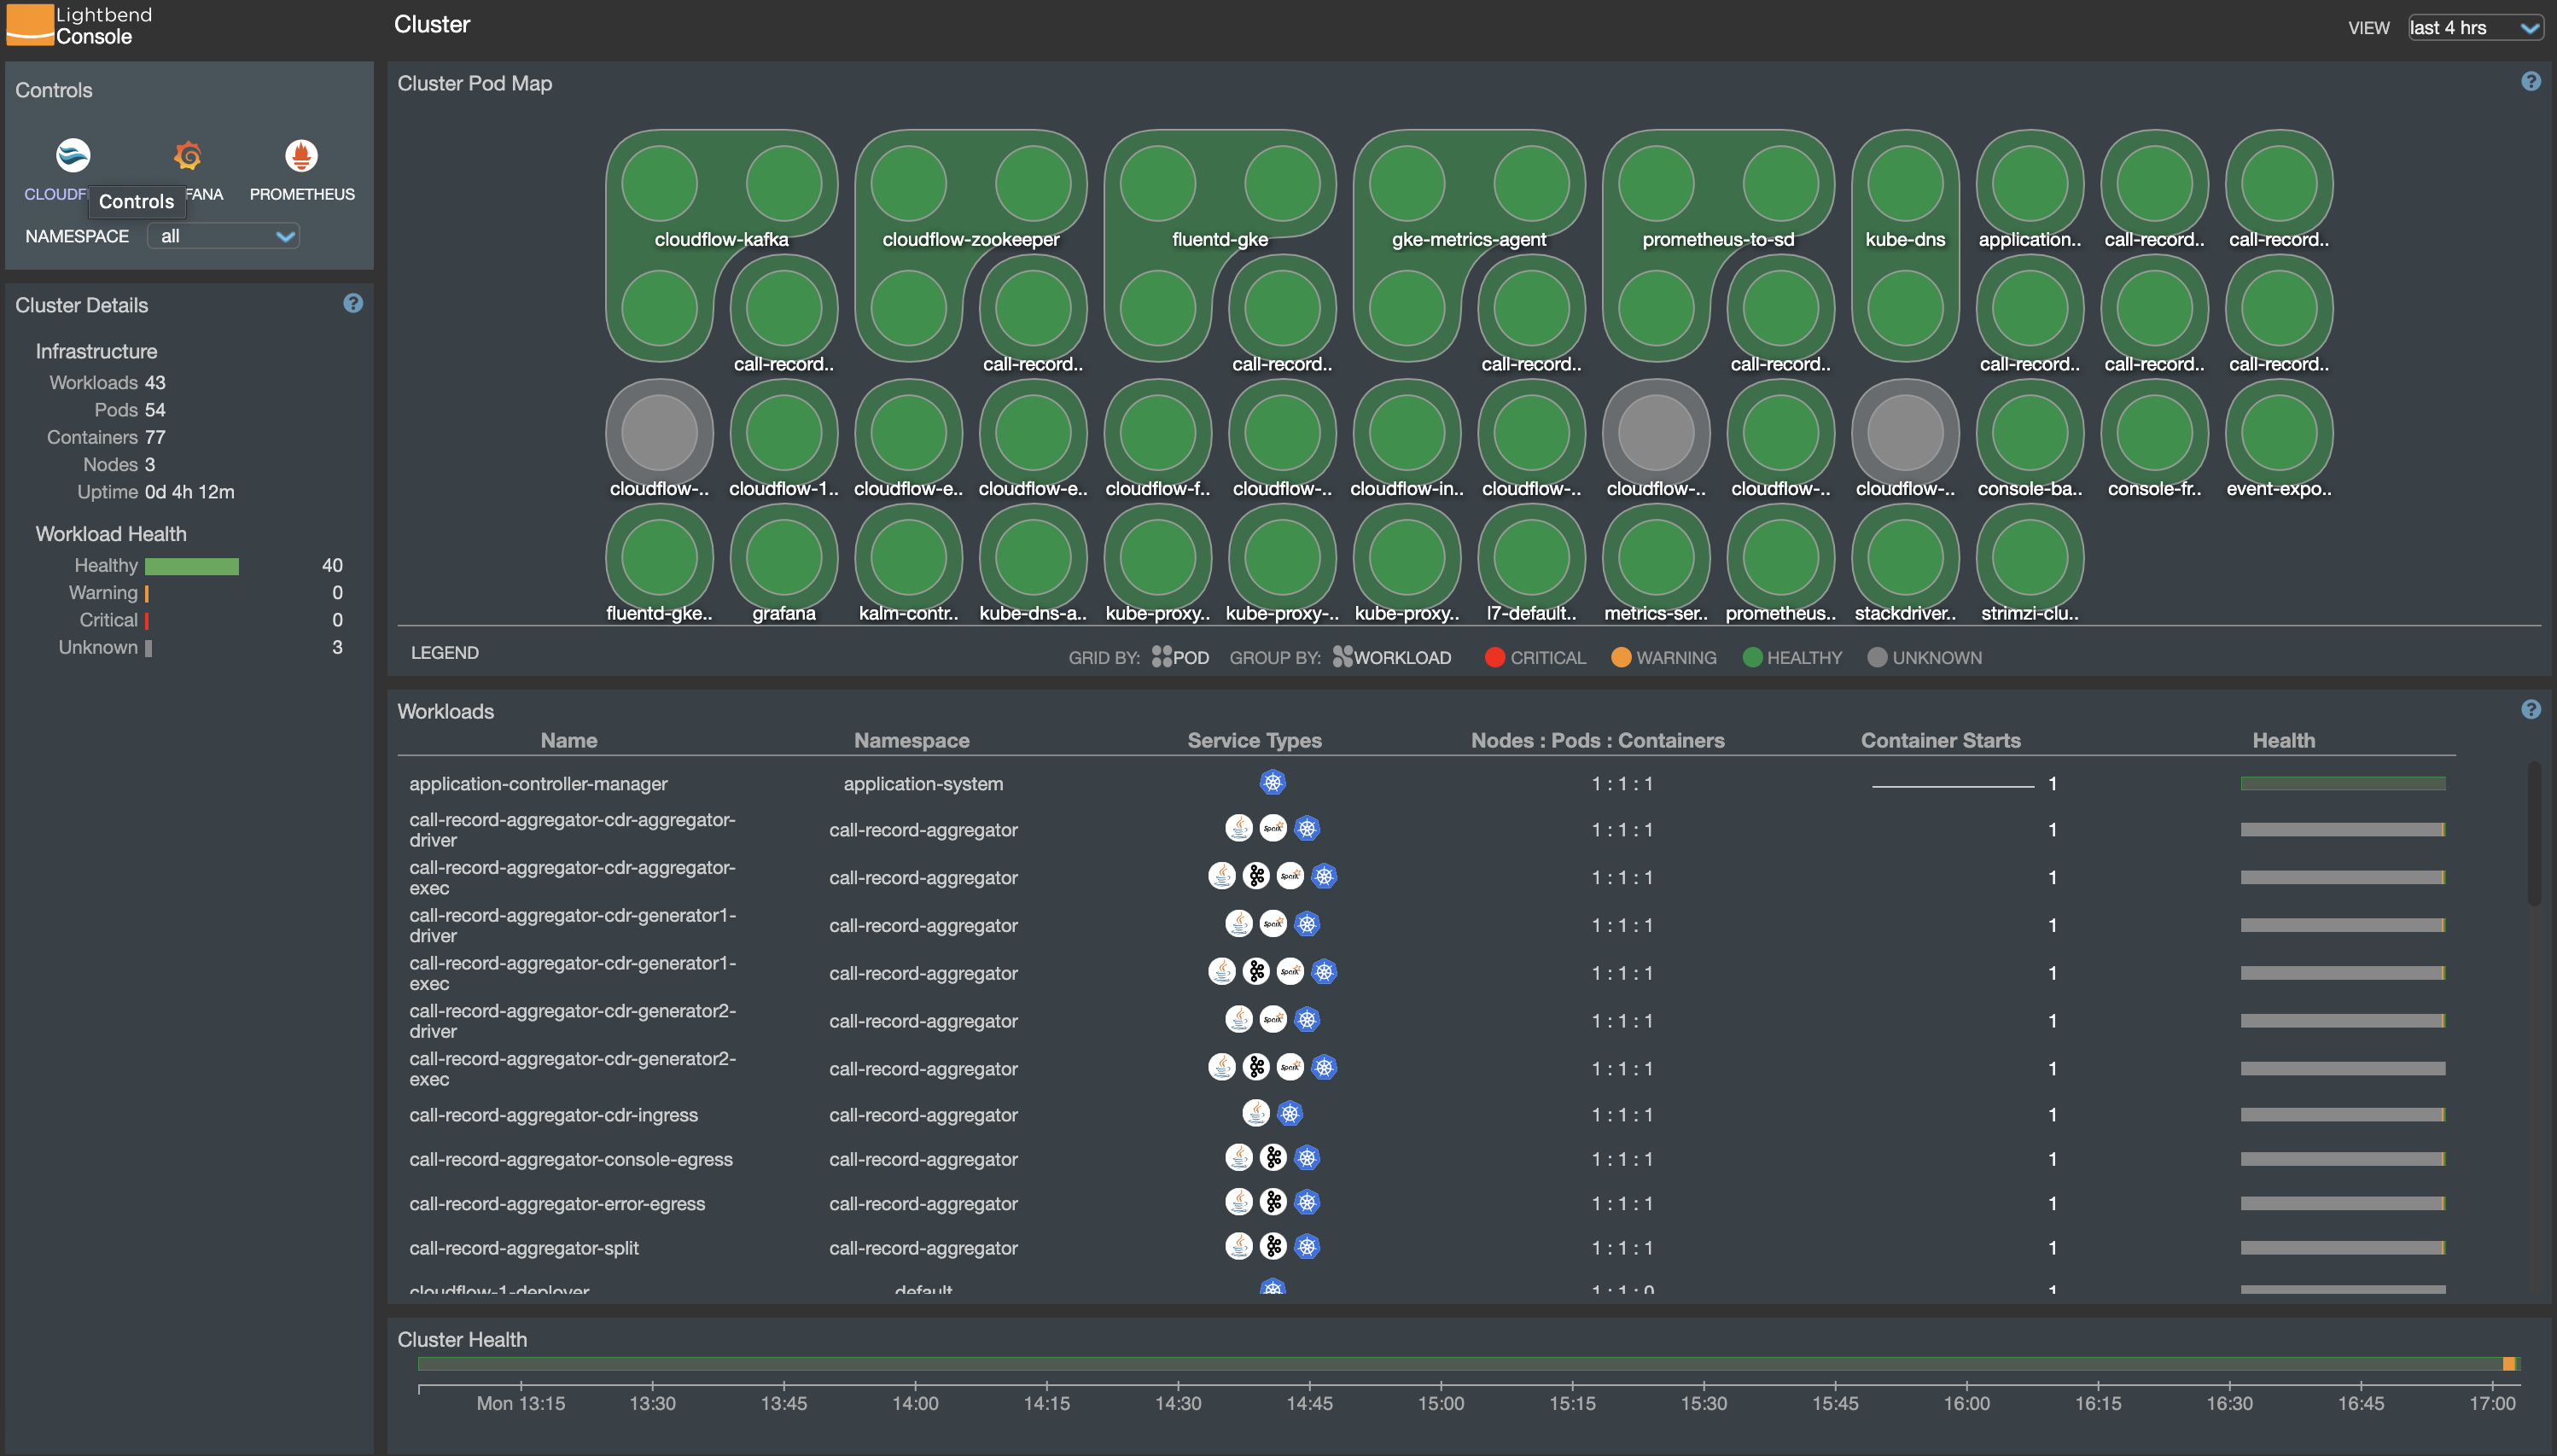
It shows an overview of current workloads running in the cluster. Click the Cloudflow logo in the "Controls" panel on the upper left corner of the screen. You will then see a list of Cloudflow applications that you have deployed:
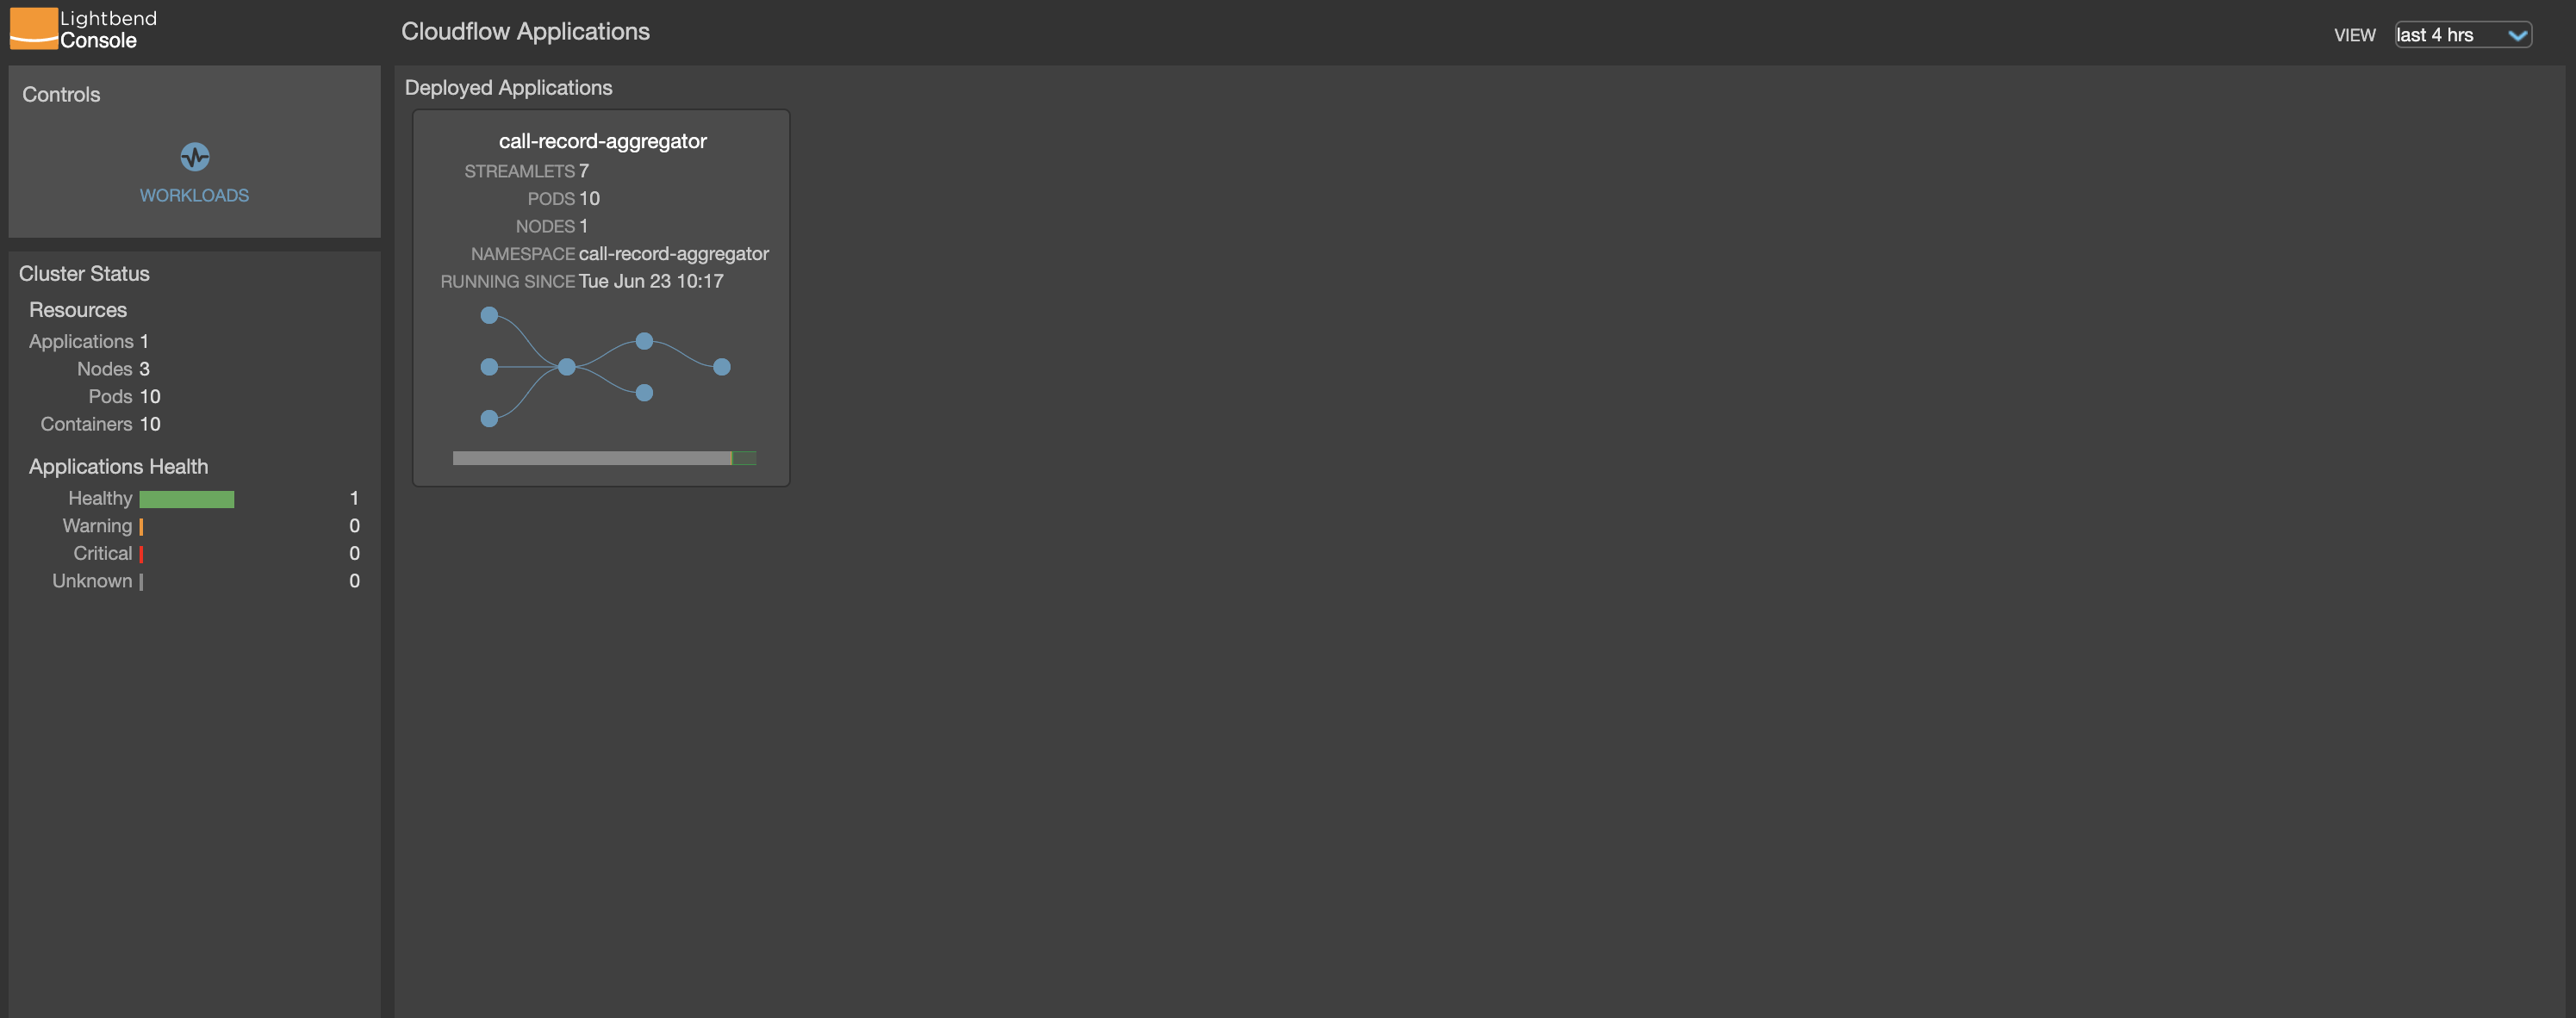
Currently there’s only call-record-aggregator running.
Click call-record-aggregator and you will see a detailed view of the streamlets:
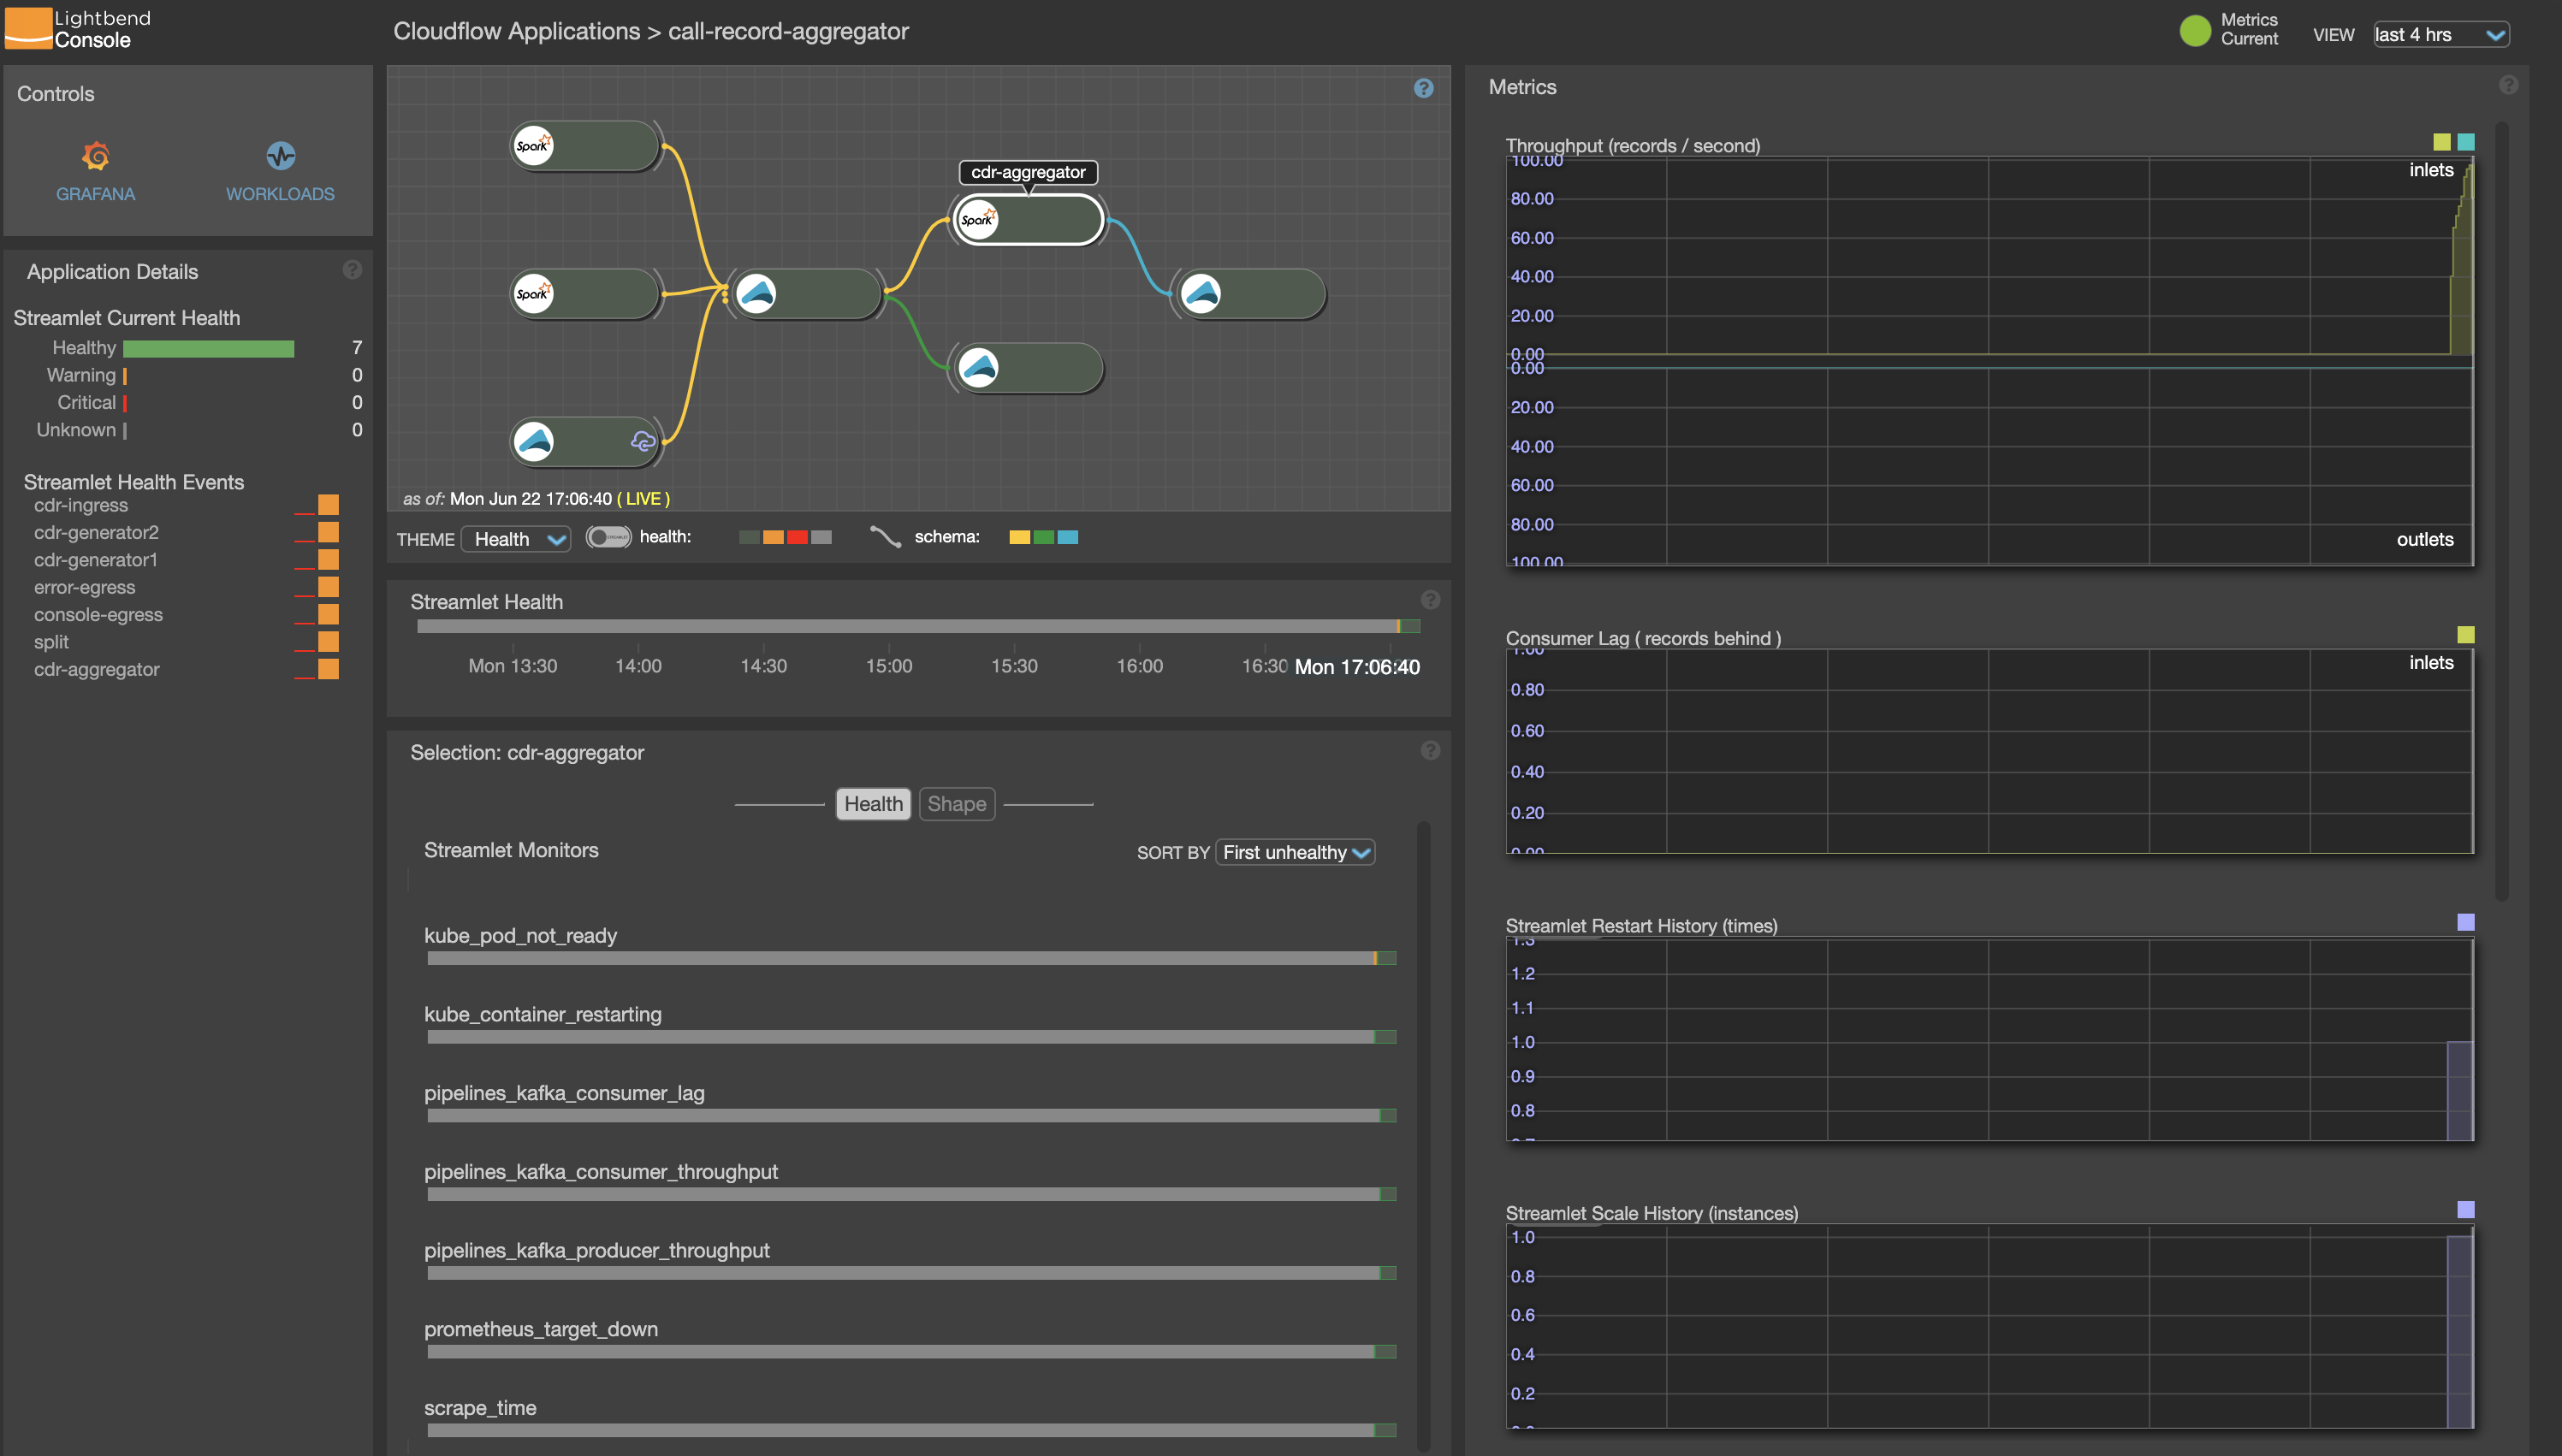
Click one of the streamlets and you should see that the data is being processed in the throughput window on the right.
What’s next
This completes the steps need to run access Cloudflow on GCP Marketplace. If you have additional questions, please refer to the FAQ. For more detailed information about Lightbend Console, refer to its documentation.